If you watch Shark Tank or Dragon’s Den, you know that consistent metric investors probe during business pitches: turnover. Why this metric? The turnover rate strongly indicates if the business is likely to yield commensurate profit on investment.
As with businesses, there are key e-commerce metrics that define your Shopify store’s success trajectory. With these metrics, you can track your store’s overall performance and gather data for better business decisions.
In this guide, we will walk you through the essential E-commerce metrics to track in your Shopify store. Before then, let’s define E-commerce metrics.
What are ECommerce Metrics?
E-commerce Metrics are key performance indicators that show you the overall performance of your business. They help e-commerce businesses monitor, evaluate and improve various aspects of their operations, from marketing and sales to customer experience.
These metrics are important as they provide valuable insight into the health of your Shopify store. You can identify gaps, re-strategize, and improve your efforts to better optimize sales and conversion.
These ecommerce metrics can be to check how customers land on your site, how long they stay, why carts are abandoned and the overall conversion rate. These metrics are used to monitor every section of a business and can vary based on each business priority.
There is possibly an endless list of metrics to track. For instance, you may consider cost-per-click an important metric. So pardon us if you were on the lookout for a metric but didn’t find it (and feel free to let us know in the comments).
12 Key Shopify ECommerce Metrics to Track
These ecommerce metrics can be monitored in the Shopify Analytics Dashboard. For other business owners, Google Analytics offers similar features to Shopify Analytics.
1. Customer Acquisition Cost
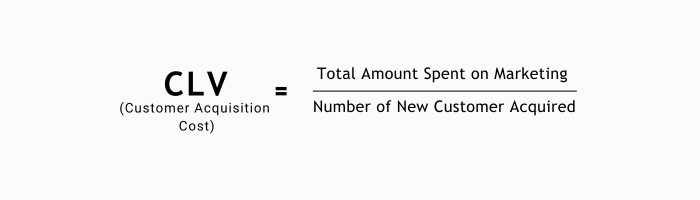
Customer acquisition cost shows the average cost of acquiring a new customer. It represents the total cost including marketing, advertisements and sales expenses. This cost is essential to assess the efficiency of your marketing campaigns. With the right customer acquisition strategies you can get more customers at a lesser cost.
To determine the customer acquisition cost, use the formula:
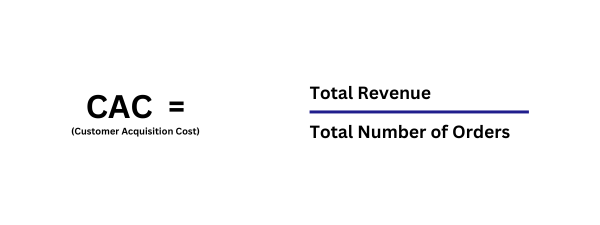
For instance, if in September, you spent $2000 on ad and marketing campaigns and recorded 100 new customers that month, your CAC is $20 per customer.
Your customer acquisition cost indicates the efficiency of your marketing strategies. One important success tip is regularly tracking your ecommerce metrics to know when to lower your customer acquisition cost while increasing or maintaining revenue.
To fully optimize Customer Acquisition Cost, you’ll need to:
- Keep a close eye on your advertising and marketing expenses.
- Experiment with different marketing channels and campaigns to identify cost-efficient options.
- Calculate the customer lifetime value to assess whether your CAC is justified by the long-term value customers bring to your business.
2. Customer Lifetime Value
Customer lifetime value estimates the total revenue a customer is expected to generate as long as they shop from your store. Unlike CAC that calculates the cost to acquire, this metric determines the long-term value of a customer.
CLV varies with industry and products. A business that sells indispensable goods (deodorants, diffusers, etc) bought frequently may record a higher customer lifetime value than a SaaS company with a monthly/yearly subscription rate.
To calculate the Customer Lifetime Value, you need to multiply the average value of a purchase, the number of times the customer will buy from you and the average length of the customer relationship in years.
For example, you have a customer who buys products worth $100 about 20 times a year, and the customer intends to shop from you for 5 years. The CLV will be 100 x 20 x 5 which equals 10,000. Therefore, the customer value is $10,000.
Improving the CLV with the action steps will affect your overall store performance positively.
- Enhance your customer loyalty through loyalty programs, personalized recommendations and exceptional customer support.
- Focus on customer retention efforts to increase CLV.
- Regularly review and adjust your CLV calculation based on real customer data.
The customer lifetime value can only be analyzed by the store owner (it’s not available on Shopify analytics). While it is added work, when done well, this metric can be a foresight into your store’s long-term profit rate.
3. Average Order Value
Average Order Value (AOV) tells you the average amount a customer spends per order in your Shopify store over a period.
AOV is an important metric for your store as it is used to track sales performance and predict customers’ buying habits. Increasing Average Order Value is important for your store’s success to boost revenue without acquiring more customers. All you need is to implement recommendation strategies such as cross-selling, upsells, bundles and volume discounts to increase AOV.
To calculate, use the formula:
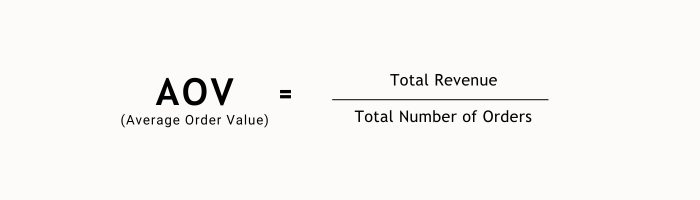
For example, if your store generated a total revenue of $2000 from 100 orders, your average order value is $20. Marketing and sales costs are excluded.
Other important steps to take to ensure higher AOV:
- Analyze products or product combinations that tend to have higher AOV.
- Implement upselling and cross-selling techniques on product pages and at the checkout stage.
- Run promotions or offer incentives for customers to increase their order size.
4. Sales Conversion Rate
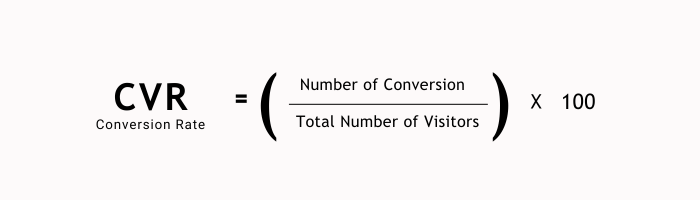
The sales conversion rate is one of the crucial Shopify ecommerce metrics to track. It measures the percentage of visitors who take desired actions on your site.
These actions include making a purchase, signing up for a newsletter or clicking a link. This metric can be monitored in the Shopify analytic dashboard or with the sales conversion rate formula as seen below:
On your analytics dashboard, the conversion rate is broken into stepwise processes, showing the number of visitors who accessed the site, the number of those who reached the checkout process and the number of people who made a purchase. You can track the point of disassociation from your site which can help you make informed decisions that improves the overall experience.
You should aim for a higher conversion rate as it indicates your website is effectively persuading visitors to become customers. These actionable steps below will help you to increase your conversion rate.
- Monitor your conversion rate regularly and set benchmarks
- Run A/B tests on different elements of your websites to see what drives higher conversions
- Investigate the reasons behind low conversion rates and make necessary improvements.
5. Bounce Rate
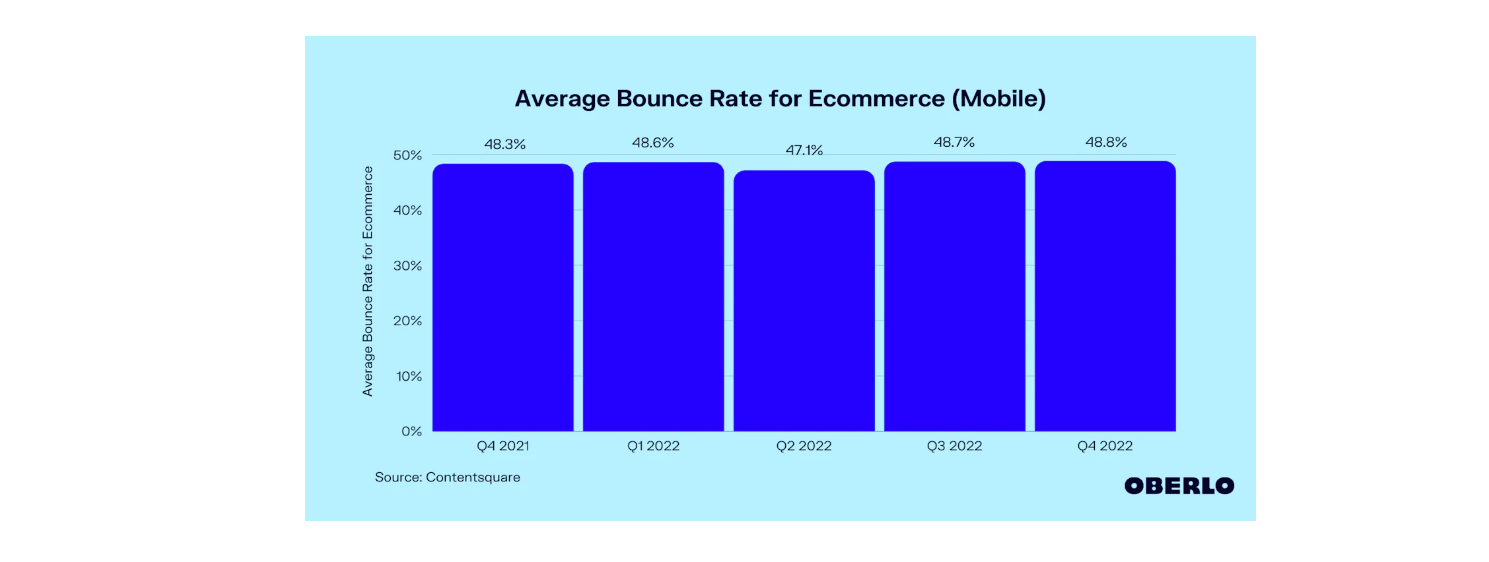
Stats show that the average mobile e-commerce bounce rate for mobile devices is at 48.8%, a 0.4 percentage rate lower than the rates on desktop.
What does that mean for e-commerce stores? It’s that for every 100 customers that land on a Shopify store, 49 exit without taking an action. This may be due to page redirection, poor load time, or clicking out to fill a form.
To keep your bounce rate in check, you need a functional website that loads in a blink, has easy navigation, and has eye-catching designs.
You can track your bounce rate in your website’s Google Analytics.
6. Cart Abandonment Rate
Some store visitors show interest in a product, add the items to the cart and only abandon the cart on the checkout page. Although this can be frustrating for you, it is quite frequent with e-commerce businesses.
This cart abandonment rate shows the percentage of shoppers who add items to their shopping carts but do not complete their checkout process. High cart abandonment rates may be an indication of issues in your checkout flow.
To calculate your cart abandonment rate, use the formula:
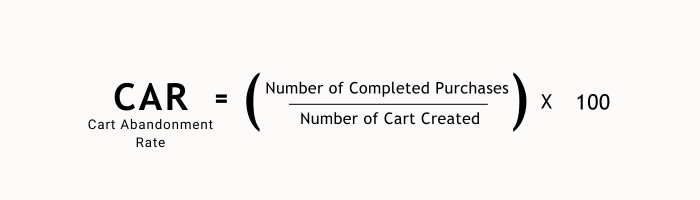
To reduce your cart abandonment rate, you need to:
- Identify and implement strategies to reduce cart abandonment by offering transparent shipping costs, simplifying the checkout process or sending cart abandonment recovery emails.
- Also, analyze the reasons behind cart abandonment through customer feedback and usability testing.
7. Customer Retention Rate
This metric measures the percentage of customers who continue to make purchases from your Shopify store over a period. This metric is important because acquiring a new customer will cost as much as 5 times what it takes to retarget your existing customer.
While getting new customers is essential for growth, customer retention helps you to increase sales at a lesser cost.
This metric can be tracked from the Shopify analytic dashboard or with the formula:
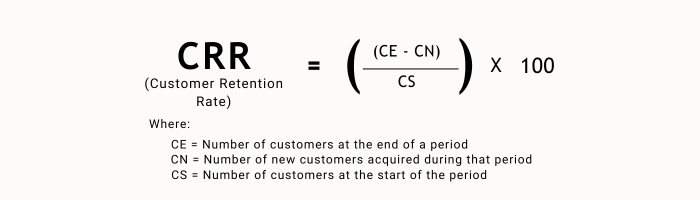
Increasing your customer retention rate will have a significant impact on your total revenue and profits. Repeat customers tend to spend more than first-time buyers.
When strategizing for CRR, aim for a 20% – 30% range. To achieve this rate:
- Implement strategies focused on customer retention like email marketing, loyalty programs and personalized recommendations.
- Monitor changes in your retention rate and assess the effectiveness of your retention efforts.
8. Email Click-Through Rate
Click-Through Rate is a Shopify metric that measures the rate at which a customer clicks on an email campaign or social media ads and lands on the store. Usually displayed in your analytic dashboard, this metric shows you the overall click-through performance.
The formula for Click-through rate:
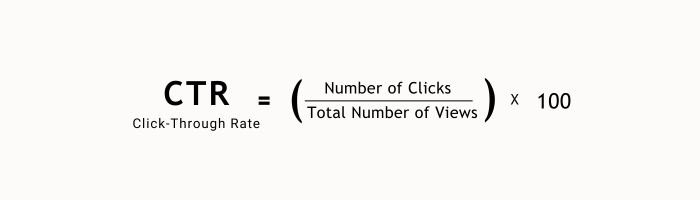
CTRs are usually lower within the range of 0.5% to 2% for both your ads and email campaigns. Therefore, if your CTR rates are above about 2%, then your email campaigns are performing well.
9. Gross and Net Profit Margin
These metrics assess your store’s profitability. Gross profit margin calculates the percentage of revenue that remains after subtracting the cost of goods sold. Net profit, on the other hand, factors in all the operating expenses including marketing and overhead costs.
To calculate these margins:

These ecommerce metrics are important because they provide insights into your store’s financial status and how effective your pricing and operational strategies are.
To stay updated with these metrics, you’ll need to
- Continually evaluate your COGS and operational expenses to identify cost-saving opportunities.
- Regularly review your pricing strategy to ensure it supports healthy profit margins.
- Explore ways to increase sales while maintaining profit margins.
10. Average Session Duration
People who stay longer in your store have higher chances of buying from your store. Average Session duration measures the average time your store visitors spend from entry to exit.
This metric is usually recorded in your Google Analytics dashboard. It begins timing once a visitor enters your store and stops immediately on exit. However, this timer stops running after 30 minutes of inactivity to give an effective timing of the session and prevent artificially inflating the session duration.
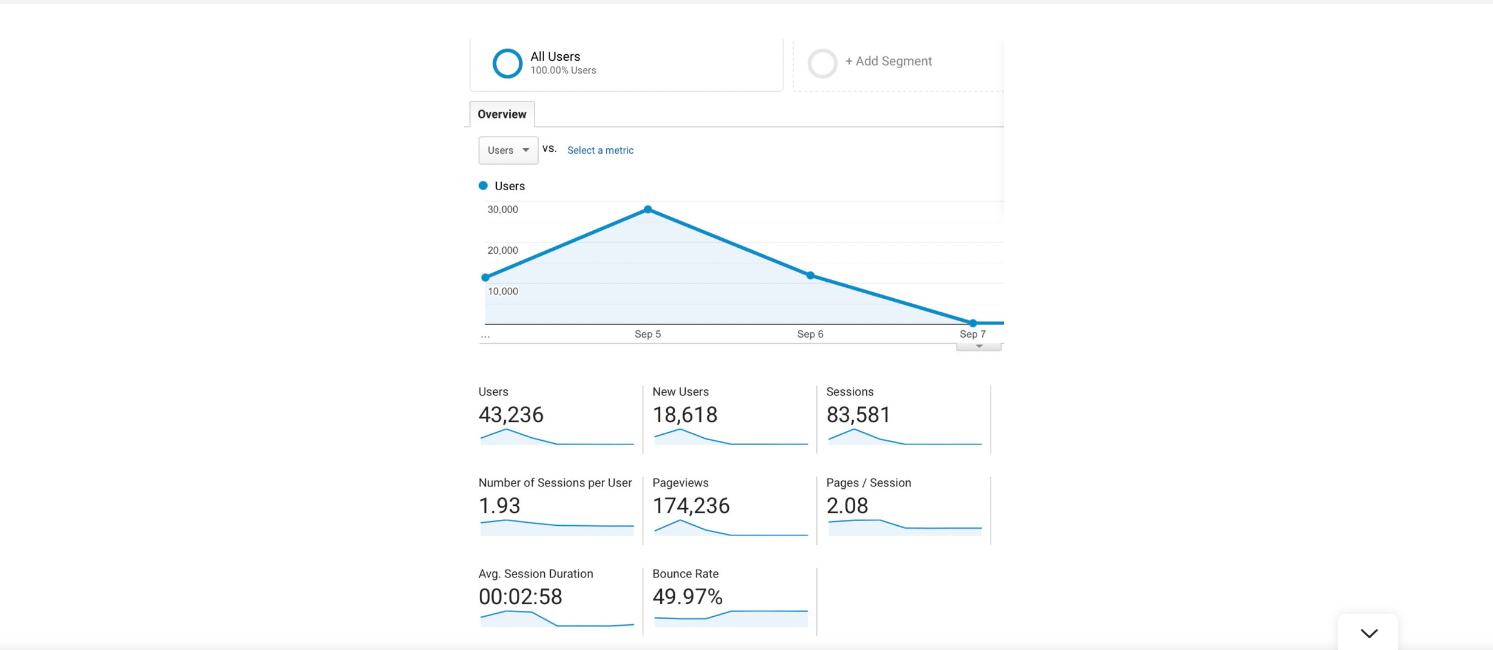
It can be assessed from the analytic dashboard under Audience > Overview > Average Session Duration as seen below:
Otherwise, you can calculate the average session duration, with the formula:
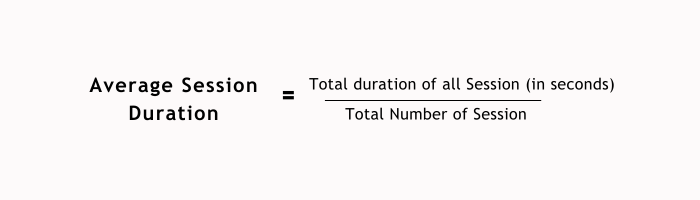
The downside of Average Session Duration is that the visitor needs to continually take action on the site to keep the timer running. For instance, when a user enters the first page, the timer starts. If she proceeds to the second page without taking any action like filling a form or clicking on a link, the timer regards that as being inactive and as such does not count as a session.
11. Inventory Turnover Rate
Turnover rate is one of the must-know ecommerce metrics.
It helps you to manage your inventory efficiently by tracking how quickly your products are sold and replaced, high sales turnover products and slow-moving items. Nonetheless, with the right tips for inventory management, you can effectively manage your store inventory and sales.

A higher inventory rate suggests that your inventory is moving quickly, reducing the risk of overstocking. To keep your inventory management effective, you’ll need to:
- Review your inventory turnover rate regularly to maintain optimal inventory levels.
- Identify slow-moving products and implement strategies to keep them moving.
- Implement inventory management tools to streamline your operations.
12. Store Sessions
These store sessions are divided into various sections such as by device type, location and traffic source:
By Traffic Source
This shows you the channel through which visitors reach your store. Some of the most common sources include:
Organic search – People who click on your store from Google or other search engines.
Direct Source – Those who land on your page by specifically typing your link into the URL search bar. That is, people who have prior communication with your store.
Social Media – These are people who land on your Shopify store through your social media platform or ads. It is important to add your Shopify store link to all your social platforms for easy access.
Email – Site visitors who land on your store after clicking an email newsletter.
These traffic statistics will help you focus on the most converting channels while improving the ineffective ones.
By Device Type
Recently, mobile e-commerce sales accounted for 60% of all e-commerce sales worldwide. To know how your customers get to your store, this metric shows the device your store visitors use to access your site; if it is a mobile device, tablet or desktop.
Creating websites that are responsive across all device types, with priority on mobile responsiveness, is good business strategy. Having a fast responsive mobile site with a shorter load time can exponentially increase your mobile sales.
By Location
This metric shows you the location of your customer. This metric can be accessed in the demographic section of your analytic dashboard.
This helps you identify areas where your campaigns are effective and where you make the least sales so you can adjust your campaigns to generate more leads from those areas.
Conclusion
Your store’s growth hinges on a combination of knowing what to sell, knowing how to sell it, and knowing how to track your sales. The ecommerce metrics reviewed inform the business decisions you make for improved sales and performance.
Looking to increase your conversion rate and profitability? Start tracking your store’s performance.
Need third-party insights and expertise? Book a call with us today to learn how we help Shopify sellers boost conversions.